
Reporting Requirements for Annual Financial Reports of State Agencies and Universities
Notes & Samples
NOTE 18 – Management’s Discussion and Analysis
Sample (Illustrative, may not tie to exhibits)
The Management’s Discussion and Analysis (MD&A) section provides an overview of the agency’s financial performance, operating results and key developments for the fiscal period. It is designed to give readers:
- A clear summary of the agency’s financial position
- Highlighting significant trends
- Major changes
- Explanations for increases and decreases in financial activity
Note: See Note 18 – MD&A Simplified Structure (PDF) under Templates & Sample Exhibits.
The information in the section and subsections below are examples of a preferred MD&A format.
Management’s Discussion and Analysis
The purpose of Management’s Discussion and Analysis (MD&A) is to help readers understand what the financial statements and notes in this financial report say about the Sample Agency’s financial health and why it has changed since last fiscal year. It contains information drawn from those other parts of the report, accompanied by explanations informed by the finance staff’s knowledge of the Sample Agency’s finances.
If you have questions about this report or require further information, contact the Sample Agency at dof@sample.cpa.gov or 000-000-0000.
Overview of the Financial Statements
The Sample Agency financial report contains basic financial statements. Those financial statements present the Sample Agency’s finances at both an overall and a detailed level. The financial statements cover the Sample Agency’s governmental activities and business-type activities (together, the primary government) and discretely presented component units.
Governmental activities comprise the Sample Agency’s most basic functions. Governmental activities primarily are financed by legislative appropriations.
Business-type activities are Sample Agency’s services primarily financed as a whole or in part with charges to customers.
The discretely presented component unit is a legally separate entity for which the Sample Agency is financially accountable.
The remaining basic financial statements present the Sample Agency’s finances in greater detail and present fiduciary activities. The fund financial statements disaggregate financial information by separate funds to report on the specific purposes for which resources are used or for which they are restricted. The Sample Agency reports on three groups of funds:
- Governmental fund financial statements report all the governmental activities except those that involve providing services to Sample Agency. In addition to the Sample Agency’s main operating fund—the general fund—those financial statements report a special revenue fund to track the use of a portion of the Sample Agency’s restricted sales tax for public safety and transportation, a debt service fund to record the repayment of outstanding bonds, and a capital projects fund to account for resources used to acquire transportation infrastructure and certain other long lived assets.
- Proprietary fund financial statements report on all the business-type activities (enterprise funds) and the services provided to Sample Agency (internal service funds).
- Fiduciary fund financial statements report resources for which the Sample Agency acts as a trustee or custodian.
The next section of this financial report contains notes to financial statements, which delve deeper into the Sample Agency’s finances as reported in the financial statements. The information in the notes is as important to understanding the Sample Agency’s finances as the information in the financial statements. The Sample Agency uses notes to:
- Present information in greater detail than is possible within the financial statements themselves
- Explain the nature of amounts reported in the financial statements and how those amounts were determined
–AND– - Report certain information that does not meet the requirements for inclusion in the financial statements (such as certain contingencies)
Types of Information in the Financial Statements
All of the Sample Agency’s financial statements, except for the governmental fund financial statements, use the economic resources measurement focus and accrual basis of accounting. In other words, they comprehensively report all types of financial statement elements:
- Assets — Resources the Sample Agency controls, from short-term assets like cash to long-term assets like roads and bridges.
- Liabilities — Amounts the Sample Agency owes, from short-term liabilities (such as salaries payable) to long-term liabilities (such as outstanding debt and net amounts owed to employees for pensions).
- Deferred outflows of resources and deferred inflows of resources — Flows that occurred during the fiscal year (or in prior fiscal years) that will not be reported as expenses and revenues until the future fiscal year to which they are related.
- Revenues and expenses — Inflows and outflows of economic resources, respectively, related to the current fiscal year.
Governmental fund financial statements use the current financial resources measurement focus and modified accrual basis of accounting to report on the sources, uses, and balances of current financial resources. Governmental funds do not report nonfinancial assets, such as capital assets, or certain other long-term items, such as general obligation bonds, but they do report the flows of current financial resources related to those long-term items, for example, the proceeds from issuing bonds or selling equipment, as well as principal and interest payments on bonds and spending on the construction of a building.
More details about the measurement focuses and basis of accounting can be found in the first note to financial statements, the summary of significant accounting policies beginning on page XX.
Sample Agency’s Financial Summary
| Governmental Activities Fiscal 20XX |
Governmental Activities Fiscal 20XY |
Business-Type Activities Fiscal 20XX |
Business-Type Activities Fiscal 20XY |
Total Primary Government Fiscal 20XX |
Total Primary Government Fiscal 20XY |
|
|---|---|---|---|---|---|---|
| ASSETS | ||||||
| Current and Other Assets | $ 849,249 | $ 760,540 | $ 96,025 | $ 100,640 | $ 945,274 | $ 861,180 |
| Capital Assets | 1,845,379 | 1,781,939 | 576,876 | 566,000 | 2,422,255 | 2,347,939 |
| Total Assets | 2,694,628 | 2,542,479 | 672,901 | 666,640 | 3,367,529 | 3,209,119 |
| DEFERRED OUTFLOWS OF RESOURCES | 89,902 | 70,018 | 3,994 | 3,130 | 93,896 | 73,148 |
| LIABILITIES | ||||||
| Current Liabilities | 975,103 | 922,831 | 103,694 | 104,502 | 1,078,797 | 1,027,333 |
| Noncurrent Liabilities | 40,321 | 46,197 | 23,601 | 24,965 | 63,922 | 71,162 |
| Total Liabilities | 1,015,424 | 969,028 | 127,295 | 129,467 | 1,142,719 | 1,098,495 |
| DEFERRED INFLOWS OF RESOURCES | 35,295 | 27,322 | 1,204 | 1,226 | 36,499 | 28,548 |
| NET POSITION | ||||||
| Net Investment in Capital Assets | 1,216,106 | 1,209,700 | 489,610 | 474,914 | 1,705,716 | 1,684,614 |
| Restricted | 705,464 | 711,690 | 17,514 | 14,985 | 722,978 | 726,675 |
| Unrestricted | (187,759) | (305,243) | 41,272 | 49,178 | (146,487) | (256,065) |
| Total Net Position | $ 1,733,811 | $ 1,616,147 | $ 548,396 | $ 539,077 | $ 2,282,207 | $ 2,155,224 |
Table 1 shows that as of Aug. 31, 20XX, the Sample Agency’s total net position—assets and deferred outflows minus liabilities and deferred inflows—was nearly $2.3 billion, an increase of $127 million or 5.9 percent compared with 20XY. This increase is primarily due to a $109.6 million or 42.8 percent increase in unrestricted net position. Most of the increase in net position was the result of the financial performance of the governmental activities. The following sections of MD&A analyze the finances of governmental activities and business-type activities separately.
| Governmental Activities Fiscal 20XX |
Governmental Activities Fiscal 20XY |
Business-Type Activities Fiscal 20XX |
Business-Type Activities Fiscal 20XY |
Total Primary Government Fiscal 20XX |
Total Primary Government Fiscal 20XY |
|
|---|---|---|---|---|---|---|
| REVENUES | ||||||
| Program Revenues: | ||||||
| Charges for Services | $45,301 | $41,393 | $62,200 | $59,998 | $107,501 | $101,391 |
| Operating Grants and Contributions | 38,163 | 31,057 | 38,163 | 31,057 | ||
| Capital Grants and Contributions | 30,885 | 14,846 | 2,938 | 2,199 | 33,823 | 17,045 |
| General Revenues: | ||||||
| Appropriations | 279,567 | 278,136 | 279,567 | 278,136 | ||
| Taxes | 78,930 | 77,074 | 78,930 | 77,074 | ||
| Gain on sales of Capital Assets | 74,940 | 61,861 | 74,940 | 61,861 | ||
| Settlement of Claims | 16,869 | 15,872 | 16,869 | 15,872 | ||
| Unrestricted Investment Earnings | 20,667 | 7,629 | 1,674 | 951 | 22,341 | 8,580 |
| Other General Revenue | 12,519 | 11,765 | 420 | 56 | 12,939 | 11,821 |
| Total Revenue | 597,841 | 539,633 | 67,232 | 63,204 | 665,073 | 602,837 |
| EXPENSES | ||||||
| Salaries and Wages | 239,431 | 201,630 | 239,431 | 201,630 | ||
| Payroll Related Costs | 79,810 | 67,210 | 79,810 | 67,210 | ||
| Professional Fees and Services | 80,254 | 67,872 | 80,254 | 67,872 | ||
| Travel | 1,260 | 965 | 1,260 | 965 | ||
| Materials and Supplies | 126 | 104 | 126 | 104 | ||
| Rentals and Leases | 2,358 | 2,163 | 2,358 | 2,163 | ||
| Capital Outlay | 5,623 | 5,623 | ||||
| Interest Expense | 1,236 | 1,254 | 42,687 | 40,526 | 43,923 | 41,780 |
| Amortization Expense | 123 | 112 | 123 | 112 | ||
| Depreciation Expense | 265 | 254 | 265 | 254 | ||
| Other Expense | 43,195 | 55,899 | 34,222 | 33,005 | 77,417 | 88,904 |
| Total Expense | 453,681 | 397,463 | 76,909 | 73,531 | 530,590 | 470,994 |
| Excess (Deficiency) Before Unusual/Infrequent Items and Transfers | 144,160 | 142,170 | (9,677) | (10,327) | 134,483 | 131,843 |
| Transfers | (18,996) | (4,639) | 18,996 | 4,639 | ||
| Unusual or Infrequent item - Flood Damage: | ||||||
| Grant Revenue | 2,500 | 2,500 | ||||
| Cleanup | (10,000) | (10,000) | ||||
| Change in Net Position | 117,664 | 137,531 | 9,319 | (5,688) | 126,983 | 131,843 |
| Net Position – Beginning of Period | 1,616,147 | 1,478,616 | 539,077 | 544,765 | 2,155,224 | 2,023,381 |
| Net Position – End of Period | $ 1,733,811 | $ 1,616,147 | $ 548,396 | $ 539,077 | $ 2,282,207 | $ 2,155,224 |
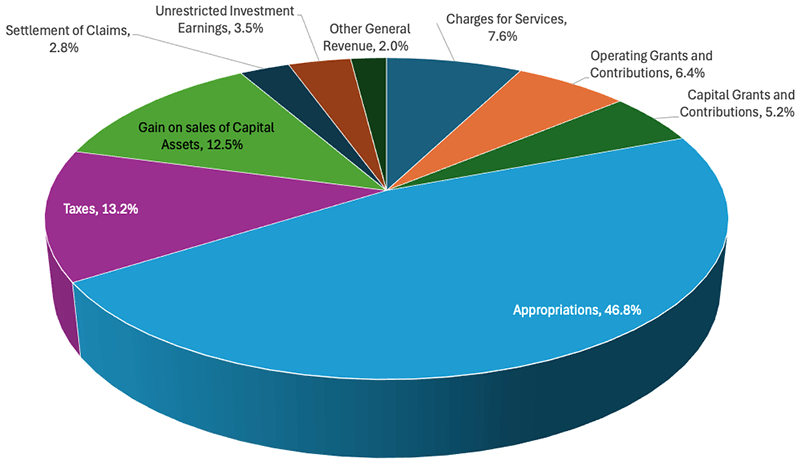
Governmental Activities: Revenues by Source
Table 3
(Exclude unusual or infrequent revenues)
| Revenue Source | Percentage |
|---|---|
| Appropriations | 46.8% |
| Taxes | 13.2% |
| Gain on sales of Capital Assets | 12.5% |
| Charges for Services | 7.6% |
| Operating Grants and Contributions | 6.4% |
| Capital Grants and Contributions | 5.2% |
| Unrestricted Investment Earnings | 3.5% |
| Settlement of Claims | 2.8% |
| Other General Revenue | 2.0% |
| Total | 100% |
Detailed Analysis
Governmental Activities
Table 2 shows that revenues continued to exceed expenses in the current fiscal year, resulting in an increase in net position. The total net position of the Sample Agency’s governmental activities was over $1.7 billion, an increase of $117.7 million or 7.3 percent from 20XY. Various events contributed to this increase in net position; however, the six primary factors affecting the change in net position are as follows:
- Increases in intergovernmental grant revenues, particularly related to capital assets
- Growth in various revenues due to the strength of the national and local economies and a major court decision
- A law that requires a portion of sales taxes to build up a financial emergency fund
- Increases in expenses for certain programs and functions
- Transfers to the business-type activities
- Damage related to the March 20XX flood
There were significant increases in both operating and capital grants and contributions in 20XX. Capital grants and contributions, which represent 5.2 percent of total governmental activities revenue, more than doubled to $30.9 million from fiscal 20XY to fiscal 20XX. A major portion of this increase was a one time $22 million capital contribution from the state, consisting of land and facilities in San Antonio that ceased operations in 2020. The Sample Agency is currently converting these facilities into a central public works and transportation garage.
Operating grants and contributions, which represent 6.4 percent of total governmental activities revenue, increased 22.9 percent to $38.2 million in fiscal 20XX. This growth was driven entirely by an increase in public safety grants from both state and federal sources, which totaled $31.4 million, accounting for more than 82 percent of operating grant revenue. Most of the additional grant funding was provided through a federal program aimed at improving local field offices and related facilities.
Increases in Revenues Due to Increased Appropriations and Taxes
The strength of the Sample Agency’s operations and the broader economy led to growth in several major revenue sources. Appropriations, which account for 46.8 percent of the Sample Agency’s governmental activities revenue, increased 2.4 percent as a result of Senate Bill 1. Tax collections, however, rose only 1.2 percent in fiscal 20XX despite a 7.9 percent increase in taxable retail sales. This lower growth reflects the expiration of a temporary 0.25 percent sales tax that had funded the extension of Highway 290 spur into downtown.
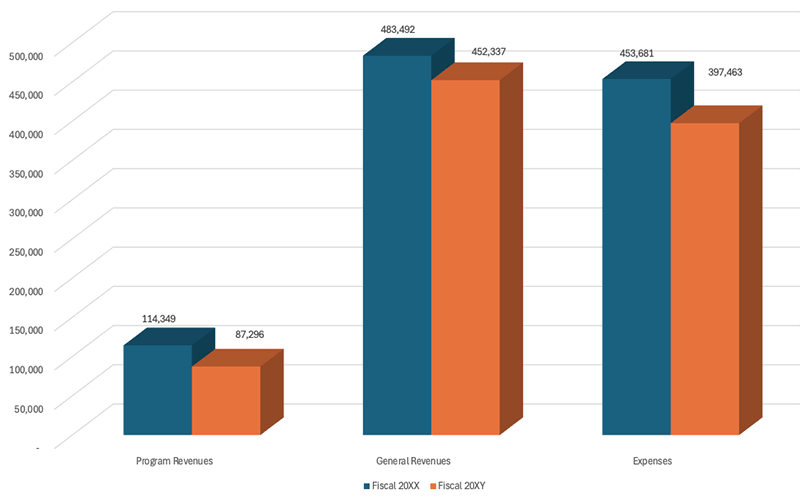
Governmental Activities: Expenses and Revenue
Table 4
For Fiscal 20XX and Fiscal 20XY (Amounts in Thousands)
| Fiscal Year | Program Revenues | General Revenues | Expenses |
|---|---|---|---|
| 20XX | $114,349 | $483,492 | $453,681 |
| 20XY | $87,296 | $452,337 | $397,463 |
The increase in revenue was accompanied by an even faster rise in the Sample Agency’s cost of providing services. Overall, governmental activities expenses grew 14.1 percent. Much of this increase was driven by higher salary and benefit costs under the current collective bargaining agreement, which provided rises of 2 to 4 percent in fiscal 20XX, depending on position.
Expenses for professional fees and services (representing 17.7 percent of total expenses) rose 20.1 percent in 20XX. This increase is primarily associated with new programs that rely on consultants and other specialized professionals.
Interest on long-term debt, which accounts for approximately 1.2 percent of total expenses, also increased 20.1 percent to $25.6 million in fiscal 20XX. The rise in interest costs was partially due to the issuance of $118.1 million in tax-backed debt during the fiscal year and partially due to a refunding of general obligation debt that temporarily increased interest costs but is expected to reduce them in future fiscal years.
In contrast, public safety, the largest governmental activities function (at 45.3 percent of total expenses) experienced a 6 percent decrease in expenses from fiscal 20XY to 20XX. Although salary increases and a 1.2 percent increase in headcount raised personnel costs for newly created programs, these increases were more than offset by reductions in other expense categories.
Other Changes in Net Position
Total governmental activities revenues exceeded expenses in fiscal 20XX by $144.2 million. This amount is higher than the $117.7 million increase in net position for two main reasons. First, the Sample Agency transferred resources from governmental activities to business-type activities (enterprise funds) to finance capital projects. The $19 million transfer consisted of $6.5 million in cash and $12.5 million from the proceeds of tax backed bonds.
Second, the Sample Agency incurred $10 million in costs related to recovery from catastrophic flooding in March 20XX, which caused damage at several field facilities. The Sample Agency received $2.5 million in state grants to partially offset these expenses. It is not yet known whether additional amounts will be recoverable through insurance claims or federal assistance. Because these flood-related revenues and expenses are infrequent and the Sample Agency has not experienced damage of this magnitude in at least 50 years, they are reported separately from other revenues and expenses in Table 2.
Governmental Funds
The Sample Agency reports three major funds individually in the governmental fund financial statements: the general fund, the debt service fund, and the infrastructure capital projects fund. Much of the discussion related to governmental activities also applies to the financial condition of these funds. However, certain factors relevant to the Sample Agency’s current financial health are more evident in the fund-level statements than in the government wide statements. Three major funds experienced significant changes, which are presented in Table 5 and discussed in more detail below.
| General Fund Fiscal 20XX |
General Fund Fiscal 20XY |
Debt Service Fund Fiscal 20XX |
Debt Service Fund Fiscal 20XY |
Infrastructure Capital Project Fund Fiscal 20XX |
Infrastructure Capital Project Fund Fiscal 20XY |
|
|---|---|---|---|---|---|---|
| Total Revenues | $ 213,376 | $ 193,431 | $ 78,976 | $ 77,013 | $ 141,327 | $ 128,968 |
| Total Expenditures | 196,136 | 194,744 | 76,435 | 74,871 | 177,395 | 130,437 |
| Excess (Deficiency) of Revenues over Expenditures | 17,240 | (1,313) | 2,541 | 2,142 | (36,068) | (1,469) |
| Other Financing Sources (Uses) | ||||||
| Other Debt Activity (Net) | 19 | 125,930 | ||||
| Proceeds from the Sale of Capital Assets | 275 | 646 | ||||
| Transfers In | 2,630 | 365 | 192 | |||
| Transfers Out | (662) | (18,294) | (2,580) | |||
| Total Other Financing Sources (Uses) | 2,243 | 1,011 | 19 | 107,828 | (2,580) | |
| Unusual or Infrequent Item – Flood Damage | ||||||
| Grant Revenue | 2500 | |||||
| Cleanup | (10,000) | |||||
| Total Unusual or Infrequent Item | (7,500) | |||||
| Net Change in Fund Balances | 11,983 | (302) | 2,560 | 2,142 | 71,760 | (4,049) |
| Fund Balances – Beginning of Period | 55,009 | 55,311 | 65,729 | 63,587 | 548,550 | 552,599 |
| Fund Balances – End of Period | $ 66,992 | $ 55,009 | $ 68,289 | $ 65,729 | $ 620,310 | $ 548,550 |
Fund balance represents the financial standing of a governmental fund as of the end of the fiscal year from a short-term perspective.
General Fund
The fund balance of the Sample Agency’s general fund increased by 21.8 percent. Excluding the effects of the flood damage, the general fund’s fund balance would have been $7.5 million greater. This increase in fund balance is attributable to:
- The 0.09 percent appropriations that have been set aside in a reserve as required by SB 1 in 2020.
- Growth in revenues (previously represented).
–AND– - A delay in planned increases in public safety expenditures as a result of the delay in the opening of new field office, offset by net flood damage expenditures.
Debt Service Fund
The Sample Agency’s inflows from property taxes may be used only to repay outstanding general obligation bonds. The small increase in inflows from property taxes mentioned earlier was more than sufficient to cover debt service fund expenditures for principal and interest. Overall, fund balance in the debt service fund increased 3.9 percent.
Infrastructure Capital Projects Fund
Outlays for capital assets increased in 20XX in the capital projects fund to the highest level in 10 years. The increase was the product of several major components of facilities construction program ending this fiscal year. (Capital asset activity is discussed further below.) Despite those capital outlays and an additional transfer out to finance capital investments in other funds, the combination of tax collections and tax-backed bond proceeds increased fund balance by 13.1 percent.
Business-Type Activities
The total net position of the Sample Agency’s business-type activities (which also are reported as major enterprise funds) increased in 20XX, though more modestly than that of the governmental activities. Business-type activities net position increased $9.3 million or 1.7 percent to $548.4 million from the prior fiscal year. The increase reflects the previously noted transfer of $19 million from governmental activities. Absent the transfer, total net position would have declined by $9.7 million, meaning expenses would have exceeded revenues for the fiscal year. In fact, unrestricted net position declined by 16.1 percent. Those results represent an improvement over 20XY, when the change in net position was a decrease of $5.7 million.
| Trust Fund Fiscal 20XX |
Trust Fund Fiscal 20XY |
Enterprise Fund A Fiscal 20XX |
Enterprise Fund A Fiscal 20XY |
Enterprise Fund B Fiscal 20XX |
Enterprise Fund B Fiscal 20XY |
|
|---|---|---|---|---|---|---|
| Total Operating Revenues | $41,286 | $37,033 | $18,669 | $18,406 | $2,665 | $2,838 |
| Total Operating Expenses | 40,777 | 39,959 | 25,378 | 25,255 | 7,433 | 5,676 |
| Operating Income (Loss) | 509 | (2,926) | (6,709) | (6,849) | (4,768) | (2,838) |
| Other Financing Sources (Uses) | ||||||
| Transfers In | 2,090 | 3,502 | 110 | 2,203 | ||
| Transfers Out | (1,980) | |||||
| Total Noncapital Subsidies | (1,980) | 2,090 | 3,502 | 110 | 2,203 | |
| Operating Income (Loss) and Noncapital Subsidies | (1,471) | (2,926) | (4,619) | (3,347) | (4,658) | (635) |
| Other Nonoperating Revenues (Expenses) | ||||||
| Earnings in Investments | 1,496 | 844 | 75 | 69 | 103 | |
| Interest Expense | (1,910) | (2,141) | (448) | (500) | (963) | |
| Capital Contributions | 2,938 | 2,199 | ||||
| Transfers in Restricted for Capital Assets | 1,032 | 497 | 15,360 | 2,384 | 252 | |
| Total Other Nonoperating Revenues (Expenses) | 3,556 | 1,399 | 14,987 | (431) | 1,524 | 252 |
| Increase (Decrease) in Fund Net Position | 2,085 | (1,527) | 10,368 | (3,778) | (3,134) | (383) |
| Total Fund Net Position – Beginning of Period | 331,657 | 333,184 | 177,997 | 181,775 | 29,423 | 29,806 |
| Fund BalanceTotal Fund Net Position – End of Period | $333,742 | $331,657 | $188,365 | $177,997 | $26,289 | $29,423 |
Among the three enterprise funds, only the Trust Fund generated positive operating results in fiscal 20XX (see Table 6). Operating expenses for the Trust Fund increased 2 percent, driven largely by a $2.8 million rise in pension expenses. Operating revenues (99.3 percent of which were charges for services) grew 11.5 percent, outpacing expenses.
Enterprise Fund A reported an increase in net position due to a $15.4 million transfer restricted for investment in capital assets. Without this operating subsidy, operating expenses would have exceeded operating revenues, primarily because of the opening of additional public field offices. To support these expanded services, the Sample Agency also purchased two new offices that had originally been planned for the following fiscal year. In addition, services A declined by nearly 3 percent in fiscal 20XX because public appointments were suspended for about six weeks due to extensive flood damage.
The net position of Enterprise Fund B decreased by $3.1 million. Although fees and charges were reduced to attract more customers, the number of appointments fell 8.8 percent. A contributing factor was the delayed opening of two offices as a result of the flood.
Significant Capital Asset and Long-Term Financing Activity
The discussion thus far has only touched upon certain significant transactions and events during 20XX with respect to capital assets and long-term debt. Overall, the carrying value of capital assets (original cost minus accumulated depreciation) increased 3.2 percent over 20XY.
However, that relatively small change does not completely capture the substantial amount of capital investment activity that occurred in 20XX.
The Sample Agency’s governmental activities had $182.8 million in its beginning balance of construction-in-progress with another $145.9 million in capital projects started during 20X5. Of those amounts, the Sample Agency put $127.4 million into operation during the fiscal year, and therefore, reclassified that amount to the other capital asset classifications of infrastructure and buildings and improvements. Additionally, the Sample Agency contributed $55.3 million of capital assets to not-for-profit organizations. This resulted in an ending balance of construction in progress of $145.9 million. Many of the completed and ongoing capital projects are a part of the new field offices improvement program.
As previously noted, significant capital investments also are expected to be made as part of converting the former state facilities to offices for public works and transportation garage. The receipt was reported as a $22 million capital contribution, which increased both the land and buildings and improvement categories of Sample Agency’s capital assets by $15 million and $7 million, respectively.
Total bonds and notes payable outstanding increased 8 percent to $718.5 million in fiscal 20XX. The most prominent aspect of that change, as already mentioned, was the issuance of $118.1 million of bonds backed by the appropriations, under the authorization of SB 1. Netted against the principal that was repaid during the fiscal year, that new issuance increased tax-backed bonds outstanding by 50.7 percent.
By contrast, the amount of general obligation bonds outstanding decreased 12.4 percent to $385.6 million. Each year since fiscal 2020, the Sample Agency engaged in bond calls and refundings of significant amounts of general obligation debt, which has had the effect of reducing annual debt payments. In fiscal 20XX, the Sample Agency called and refunded $32.2 million of general obligation bonds. Additionally, the Sample Agency has not issued any new general obligation debt since fiscal 2019. As of the end of fiscal 20XX, the Sample Agency’s bonds—both general obligation and tax-backed—continued to possess the highest available rating from the municipal bond ratings services. Because all of the Sample Agency’s debt is voter approved, none of its outstanding debt is subject to the state-imposed debt limit.
Currently Known Facts, Decisions or Conditions
The Sample Agency is aware of four developments that will have an impact on the Sample Agency’s finances in the future and have therefore been incorporated into next fiscal year’s budget:
- Consultants’ new contract
- Amendments to vendor contracts
- Recent economic reports
- Adoption of the state budget
Consultants’ New Contract
The collective bargaining agreement with the consulting company expired at the end of fiscal year 20XX. On July 15, 20XX, the Sample Agency reviewed a new four year contract that is retroactive to the start of next fiscal year. Key provisions of the agreement include annual pay increases of 6.5 percent. The contract also revises certain rules to allow Sample Agency staff to take a more active role in new programs, which is expected to increase overtime costs for state employees.
Amendments to Vendor Contracts
The first mid year amendment to the Sample Agency’s operating budget addresses variances identified in the first quarter actuals ending Nov. 30, 20XX. Increased expenses from new vendor contracts were a major driver of the amendment. Overall, first quarter spending was 4.6 percent below budget. If this trend continued through the fiscal year, funding for vendor contracts would fall short by approximately $1.9 million. In response, the Sample Agency chose to closely monitor tax receipts for any further decline and to delay decisions on new vendor contracts. To help offset the potential revenue loss, the Sample Agency identified several high cost contracts to review through the vendor process and adjusted department budgets accordingly.
Recent Economic Reports
The unemployment rate for the Sample Agency has increased slightly for five consecutive months through August 20XX. Unemployment in May 20XX was 2.7 percent. By August 20XX, unemployment had reached 3.4 percent. Building permit applications were assumed in the adopted budget for next fiscal year to increase approximately 2 percent, a lower level than the average annual increase of 4.1 percent since 2020. However, through the first quarter of next fiscal year, applications were flat compared with the same period from the prior fiscal year.
Adoption of the State Budget
In May 20XX, the state adopted its operating budget for the fiscal year ending Aug. 31, 20XX. Several components of the state budget affect the Sample Agency’s finances, and two appropriations may have negative impacts. First, the adopted budget includes a plan to withhold a quarter of a percentage point from tax collections beginning next fiscal year. Second, the state is winding down a grant program that has historically provided funding for the Sample Agency’s capital projects and related maintenance.
The Sample Agency’s Capital Improvement Plan assumed this program would support portions of the facilities improvement initiative and the conversion of buildings into public works offices and a transportation garage. Based on the published long-term capital plan, the Sample Agency budgeted $28.7 million from this grant program through 2040 and continues to expect receipt of that amount through the end of the grant period.