Report to the 86th Legislature: CAPPS — ERP in Texas
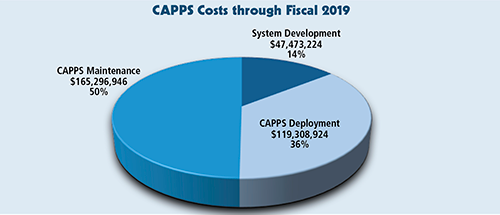
CAPPS Costs through Fiscal 2019
| Type of Cost |
Fiscal 2010 | Fiscal 2011 | Fiscal 2012 | Fiscal 2013 | Fiscal 2014 | Fiscal 2015 | Fiscal 2016 | Fiscal 2017 | Fiscal 2018 | Fiscal 2019 | Grand Total |
|---|---|---|---|---|---|---|---|---|---|---|---|
| System Development |
$ 19,433,726 | $ 15,516,243 | $ 3,411,742 | $ 6,040,054 | $ 2,131,859 | $ 939,600 | $ 0 | $ 0 | $ 0 | $ 0 | $ 47,473,224 |
| CAPPS Deployment |
0 | 0 | 1,473,515 | 1,651,079 | 4,788,810 | 4,796,289 | 26,291,246 | 26,696,329 | 27,035,131 | 26,576,525 | 119,308,924 |
| CAPPS Maintenance |
2,183,915 | 2,290,876 | 9,459,601 | 13,803,084 | 21,066,739 | 30,736,206 | 20,739,450 | 18,032,908 | 22,022,503 | 24,961,664 | 165,296,946 |
| Total Agency Project |
$ 21,617,641 | $ 17,807,119 | $ 14,344,858 | $ 21,494,217 | $ 27,987,408 | $ 36,472,095 | $ 47,030,696 | $ 44,729,237 | $ 49,057,634 | $ 51,538,189 | $ 332,079,094 |
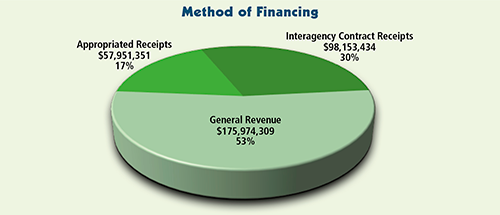
| Method of Financing |
Fiscal 2010 | Fiscal 2011 | Fiscal 2012 | Fiscal 2013 | Fiscal 2014 | Fiscal 2015 | Fiscal 2016 | Fiscal 2017 | Fiscal 2018 | Fiscal 2019 | Grand Total |
|---|---|---|---|---|---|---|---|---|---|---|---|
| General Revenue |
$ 2,406,841 | $ 1,901,871 | $ 2,395,651 | $ 6,639,717 | $ 12,294,298 | 13,888,058 | $ 35,977,341 | $ 32,310,136 | $ 34,343,406 | $ 33,816,990 | $ 175,974,309 |
| Appropriated Receipts |
0 | 0 | 0 | 75,890 | 3,331,526 | 12,407,839 | 4,252,343 | 10,286,098 | 12,139,359 | 15,458,296 | 57,951,351 |
| Interagency Contract Receipts |
19,210,800 | 15,905,248 | 11,949,207 | 14,778,610 | 12,361,584 | 10,176,198 | 6,801,012 | 2,133,003 | 2,574,869 | 2,262,903 | 98,153,434 |
| Total Agency Project |
$ 21,617,641 | $ 17,807,119 | $ 14,344,858 | $ 21,494,217 | $ 27,987,408 | $ 36,472,095 | $ 47,030,696 | $ 44,729,237 | $ 49,057,634 | $ 51,538,189 | $ 332,079,094 |
FTEs |
Fiscal 2010 | Fiscal 2011 | Fiscal 2012 | Fiscal 2013 | Fiscal 2014 | Fiscal 2015 | Fiscal 2016 | Fiscal 2017 | Fiscal 2018 | Fiscal 2019 | Grand Total |
|---|---|---|---|---|---|---|---|---|---|---|---|
| Accumulative (per fiscal year) |
17.1 | 19.2 | 24.6 | 25.1 | 29.5 | 30.4 | 46.8 | 43.1 | 43.2 | 54.0 | 54.0 |
Note: The figures above reflect Comptroller expenditures for the development, deployment and maintenance of the CAPPS system since inception. Any internal support costs agencies incurred to deploy the system are not included in these totals. Fiscal 2017–19 are open budget years as of Sept. 1, 2018, and represent estimated expenditures.


